Latest changes on emta.com
Public transport networks
General map of the network in Rotterdam Public transports in Rotterdam harbour area General map of network in The Hague
Financing/Pricing data
Funding of public transport (2011) Approximately 50% of the total cost of the services is financed by ticket sales and revenues from commercial activities. The reminder is financed by tax revenues contributed by the Stockholm County. Fares (2011) Tickets are sold as either single fare tickets (Zone tickets) or travelcard tickets for short and longer
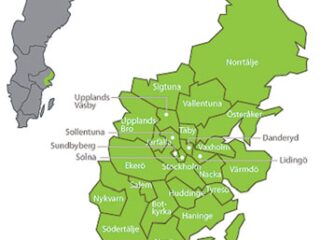
Identification of metropolitan area
Stockholm is the capital and the largest city of Sweden and constitutes the most populated urban area in Scandinavia. The Stockholm metropolitan area is home to approximately 22% of Sweden’s population. Stockholm County is divided into 26 municipalities Population of Stockholm County: 2.1 million inhabitants Area of Stockholm County: 6519 km2 A total of 446
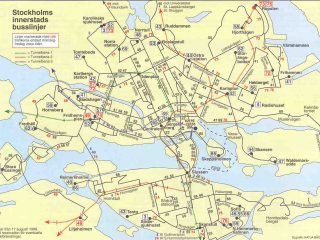
Public transport networks
Description of the network The core of the SL network consists of the metro and commuter train. Rail traffic also consists of suburban railways and tramways. The bus network covers the entire county. Every weekday a total of more than 739 000 travelers travel with SL. The total number of boardings, i.e. segment journeys on
Financing/Pricing data
Fares 2015 Within the VVS integrated transport network, passenger fares depend on the number of zones travelled. All tickets are multimodal and permit interchanges between metropolitan light rails, general railways, suburban railways, and bus services. Prices: Single ticket EUR 2.30 (1 zone) – EUR 8.30 (7 zones) 4-journey ticket EUR 8.70 – EUR 31.40 Weekly
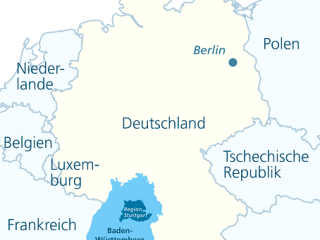
Identification of metropolitan area
Presentation : The Verband Region Stuttgart provides a framework for regional co-operation between the capital of the federal state of Baden-Württemberg, the city of Stuttgart, and the surrounding administrative districts of Böblingen, Esslingen, Göppingen, Ludwigsburg, and Rems-Murr-Kreis. Founded in 1994, the Verband Region Stuttgart is the political entity for the Stuttgart Region with its own
Public transport networks
Public Transport System The integrated transport network (VVS) covers the regional administrative districts. VVS is jointly owned by the operators (50%) and public authorities (50%). Its main functions are ticketing revenue and providing passengers with timetables and traffic information. Public transport within the region is mainly operated by: General map of the network (source www.
Financing / Pricing data
Funding of Public transport (2011) The Regione Piemonte budget for public transport funding is € 425 million. 45% of this budget is transferred to the Agenzia per la Mobilità Metropolitana. Further funding is provided by the Torino municipality and by other municipalities of the metropolitan ring. Operations Bus / Tram Interurban bus *** Metro *
Financing/Pricing data
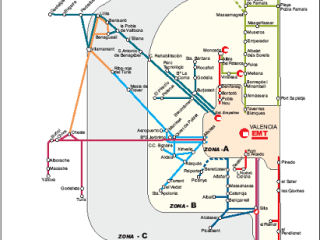
Funding Fundings of PT services are provided by transport tickets sales and contributions from the local and regional administrations. In other Spanish areas the state also contribute to finance PT in metropolitan areas and the ATMV shall also receive these funds in the next national budget. The funding of the transport authority scheme in 2018
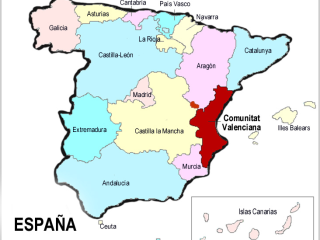
Identification of metropolitan area
Description of metropolitan area The Valencia Region is one of the 17 Spanish regions, and is formed by 3 provinces.The Metropolitan Transport Area of Valencia is formed by 60 municipalities with a population of 1.8 million of inhabitants, and a surface of 1,474.6 km2. The capital city Valencia has a population of 786,000 inhabitants in
EMTA Members