AMMT administers sample surveys every 2-3 years to analyze mobility trends in the metropolitan area and the perceived quality of public transport modes, private car and bicycle. Data series are used to implement future policies on mobility planning.
11 editions of the survey have been administered. Nine editions (from 1991 to 2010) have been focused on the Province of Torino (316 municipalities and 2,3 million inhabitants) except the 2004 and 2013 editions that have been focused on the territory of the Piemonte Region (1206 municipalities and 4,4 million inhabitants).
For the 2013 edition over 50.000 inhabitants aged 11 and over were interviewed as a representative sample of Piemonte Region preceded by a letter of presentation to 210.000 addresses.
In order to investigate the whole sample of citizens with the given quota constraints within the scheduled deadline two different CATI teams were employed in parallel.
The post-processing phase has been complicated due to the verification of the collected data. Furthermore, all origin and destinations of trips have been geo-referenced and assigned to more than 1400 zones based on the address declared during the interview. First results were published in April 2015 as a subset focused on the inhabitants of the PTA metropolitan Area (32 municipalities and 1,5 million inhabitants).
A new survey is underway on all region, the results of which will be available in the second half of 2022.
The main figures
PTA Area is stable over the last 10 years, however, ageing of the population proves progressive: share of elderly people (64 years and over) is increasing: from 22% in 2004 to 25,9% in 2013.
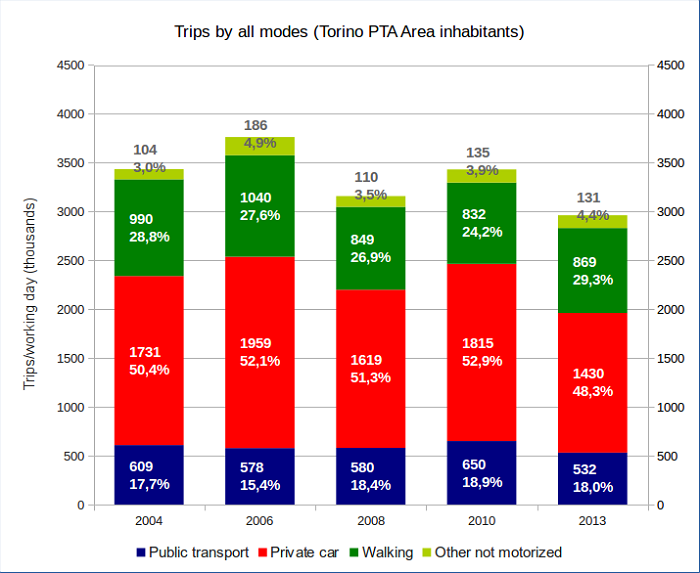
The number of trips dropped from 3,4 million / day in 2010 to 2,9 million day in 2013:
- a 13% reduction of the overall number of trips;
- a 20% reduction of motorised trips;
- a slight increase of the soft modes (walking, cycling).
The average number of daily trips per person dropped from 2,4 (2010) to 2,1 in 2013.
The market share of public transport in motorized trips rose from 26,4% to 27,1%.
The market share of bicycle increased from 1,7% to 2,8% in the main city, the highest market share for cycling in the last 10 years.
30,8% of trips have been work related, 5,9% for education, 30,3% for shopping and errands, 7,5% to accompany other people and 25,5% for other purposes.
The perceived quality of public transport reached a score of 6,8 (out of 10) whereas the private car reached 7,4. With an 8,4 the Metro obtained the best score, while suburban rail (reorganized in 2013), having launched a new brand for the commuter rail product scored best measured over the last 10 years with a 6,7.
Based on the same subset of data (PTA Area inhabitants) also single reports focused on the residents in all 32 municipalities were measured. The PTA Area reports are published on our website (in Italian only).
For information: Gianni Miceli